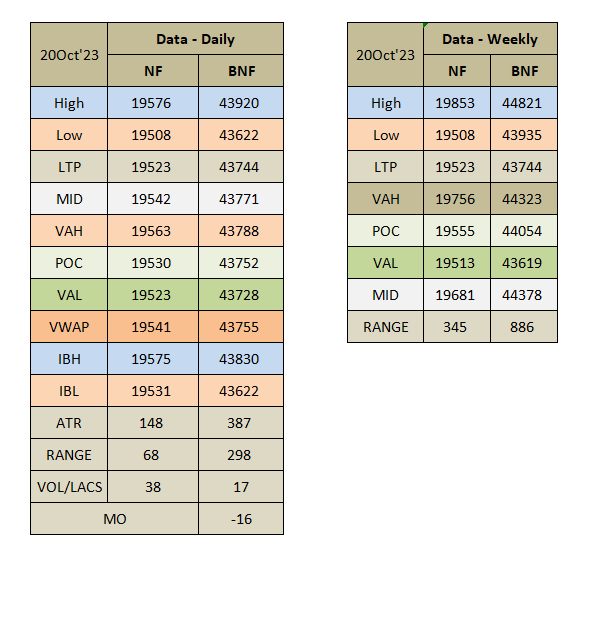
Daily market summary of NF and charts, data of NF & BNF -20Oct'23
- Green tickz
- Oct 22, 2023
- 2 min read

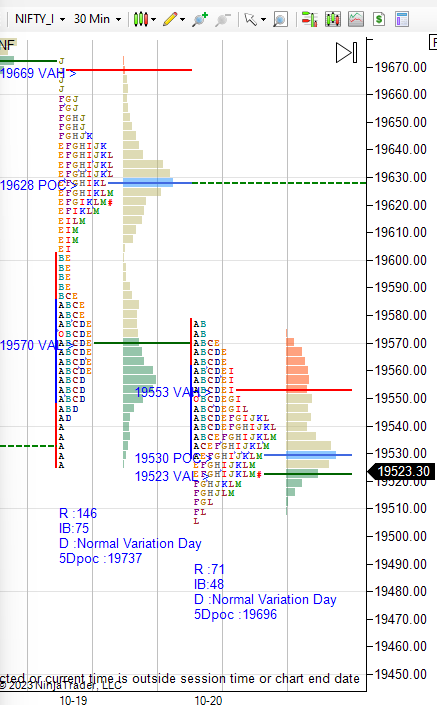
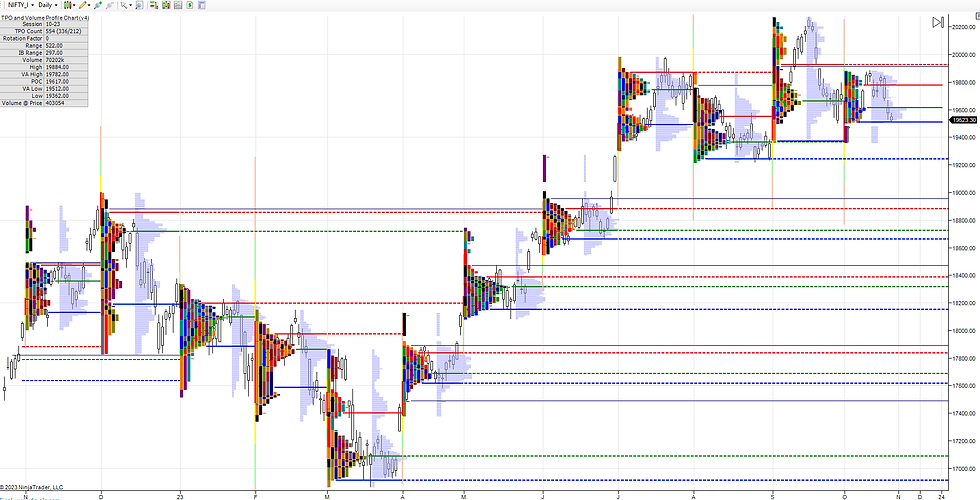
NF had double distribution profile with tail at both ends on expiry day.With skewed upper disbn structure + data of poor demand suggested push back into lower disbn of that DD profile next possible. NF had a open at PDL zone then all day gone for accepting lower disbn to clos at dVAL.
Balanced profile with narrow range and lower volume with acceptance in lower disbn of DD uptrend day closing at dVAL..As discussed in live commentary, weakness. Imbalance possible next.
Buyers next need to move higher above this balanced profile or reject below this profile quick and accept above POC zone for a move higher.
3rd day of one time frame down.
Swing suggested to have balance to downside move towards 19540/19480/19420/19365 staying below 19690-19720 band. It probed 19540 again and same view with same negation.
Levels wise for next session, move above 19570 could get 19595-19605/19630/19660 if sustains 19690-19710. Not able to stay below 19440 and move above 19510 could get 19535/19570.Not able to stay above 19570 could drop to 19520and weak below that for 19480/19450/19415 if sustains 19380-19365 possible.
Weekly :
For the week, below 19695 expected move towards 19570/19520-19480..Move above 19720 expected 19780/19840/19920. NF saved 19695 at start of week to move to 19780/19840 then failed there and came down to clear 19695 to probe 19520.Inside week closed at low.
Buyers held mechanically at low of last week and printed inside week at close.Not able to defend 19510 at start of week could get 19450/19420/19360. If any response from buyers in 19360-19400 zone then could see bounce towards 19500-19520/19570 if accepts 19620 max then rotation down possible..Any strength for the week above 19620 for 19670/19720 then rejection possible there..If accepts there, 19780/19840 next. No respect in 19360-19400 zone means 19290/19240/19200 and more downside possible.
Monthly :
19620 considered as pivot for OCT..Holding that, move higher marked for 19840 and not able to stay higher and giving up pivot expected move back to 19520-19480/19360. NF moved to 19840 and dropeed till 19520 again. Same pivot holding now looking for same obj downside towards 19400-19360. Volume and ranges are missing.So, 19360-19400 if we get there,expecting to hold for a bounce towards pivot.If 19360 goes means month could see range extension down towards 19240-19200.
Charts
Daily :
Weekly :
Monthly :
Data :
Notes :
a) Check glossary page in website if any of the terms used in the post are not clear.
b) If images are not clear, click on them for enlarged view.


Comments